Conferences, IT Operations Management, Moviri, Partners, Performance Engineering, Performance Optimization
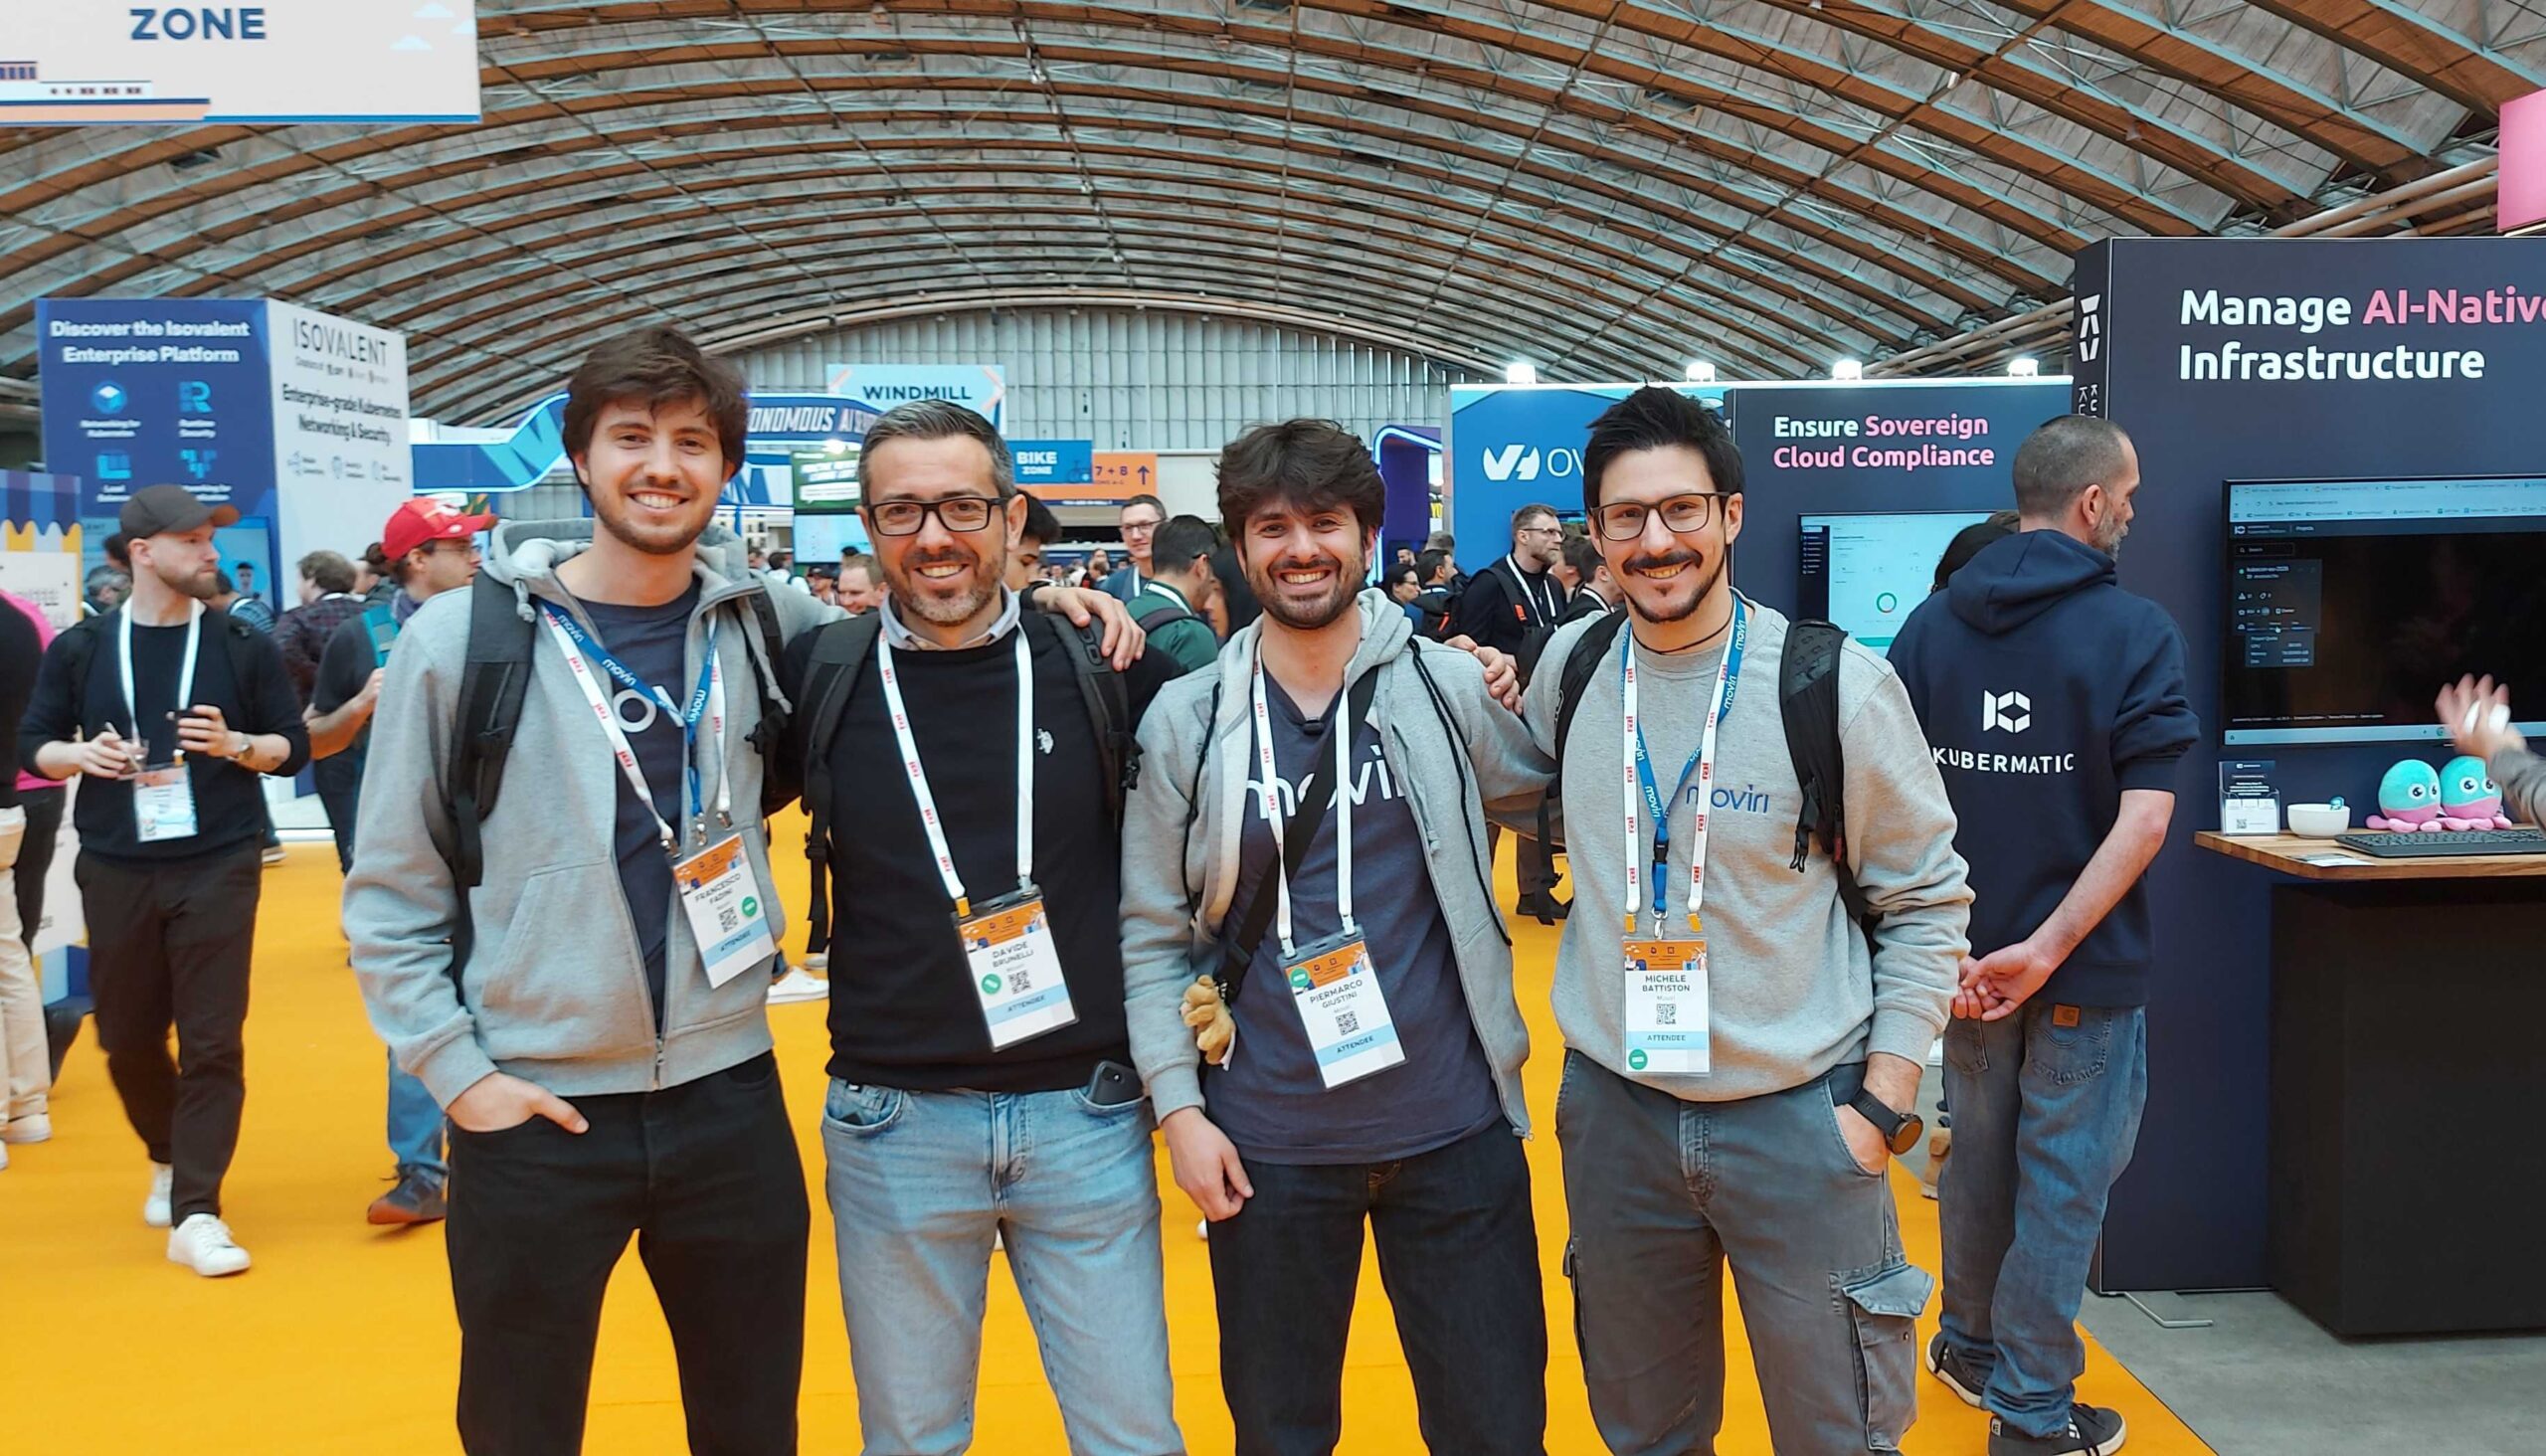
From Cloud‑Native to AI‑Native: what we saw at KubeCon 2026
- By Moviri Team
31 Mar
KubeCon Amsterdam 2026: What We Saw, What It Means, and What We're Doing About It
KubeCon Europe drew over 15,000 engineers, architects, and technology leaders to Amsterdam this year. Our team spent three days on the ground: attending keynotes, crawling exhibition booths, running deep-dive demos with customers, and talking to the people building the tools that will define the next cycle of cloud-native infrastructure.
Here is what we took away. Not a recap of announcements. A reading of where the industry actually is, based on what we saw in the sessions and, more importantly, what we heard in the conversations around them.
Kubernetes won. Now what?
The opening keynote made a point that would have been contentious two years ago and now feels obvious: Kubernetes adoption is near-universal. The debate over whether K8s is the right platform for AI workloads is over. The question has moved to how.
Google’s keynote framed Kubernetes as evolving from a platform-building tool to the nervous system of autonomous infrastructure. That’s a significant claim and the exhibition floor provided the evidence for it. With the community taking ownership of GPU resource drivers, K8s is becoming the neutral control plane for what you might call the AI economy: a shared substrate where models, agents, and inference engines compete on merit rather than on who controls the underlying stack.
Running a model in a notebook and running it reliably in production are not the same problem. The keynote called this the “Cloud Native Inference Challenge,” and the name fits. Inference at scale requires load balancing, disaggregated serving architectures, and GPU scheduling that Kubernetes was never designed for. Tools to close that gap exist. They are young, and adoption is uneven.
Three themes that defined the Kubecon EU conference
1. AI agents as first-class infrastructure citizens
The biggest shift we saw at KubeCon is who the tools are being built for. Not humans looking at dashboards. AI agents that need to act on infrastructure autonomously. Making that work in production requires two things: the compute infrastructure to run the models, and a secure interface for agents to communicate with your systems.
The infrastructure: Running the models
Running AI at scale is a resource scheduling problem. Kueue is emerging as the standard for GPU resource management, giving teams a way to share compute across workloads without conflicts.
But scheduling compute is not enough if inference is slow. This is where engines like vLLM and LLM-D come in. LLM-D is a Kubernetes-native framework built to process AI queries at scale. Together with NVIDIA’s AI Cluster Runtime (AICR), which moves models from training into production, these tools form the compute layer of the modern AI stack.
Kubernetes Dynamic Resource Allocation (DRA) ties this together. DRA allows the cluster to assign GPU and accelerator resources in real time based on actual workload demand, which directly affects cost, reliability, and performance. It is the mechanism that makes adaptive resource management possible at the scheduler level rather than through manual overprovisioning.
The interface: How AI talks to IT
What connects all these infrastructure projects is one simple idea: the primary consumer of your infrastructure will be an agent, not a person at a terminal. Humans define intent. Agents execute.
That only works if the infrastructure is built for it. You cannot build reliable agent automation on top of undocumented or inconsistent APIs. Clean API governance is the prerequisite, not the nice-to-have.
The communication chain repeated across the floor follows a clear pattern. A human assigns intent to an agent through prompting. The agent calls on specialized Skills, scoped capabilities that teach it how to handle specific tasks like diagnosing a network error or scaling a deployment. Those Skills connect to the environment through MCP (Model Context Protocol), a standardized, secure bridge between agents and IT systems. MCP then triggers the underlying, well-governed APIs to execute the action.
This chain from a smart Agent, using specialized Skills, passing through a secure MCP bridge, down to a reliable API turns a chaotic pile of tools into a functional, automated ecosystem.
2. Sovereignty is now a technical conversation
If Day 1 was about scale, Day 2’s keyword was freedom. There is a visible, collective push across European enterprises to avoid becoming locked into closed ecosystems. This isn’t new as a sentiment, but the tooling to act on it is finally catching up.
The open source roundtable, led by Solo.io, stated it plainly: the future of cloud native is agentic, and that future needs to be open. The logic is straightforward. If agents are going to orchestrate your infrastructure, you cannot afford to have their decision-making trapped inside a vendor’s black box.
This played out in concrete ways on the floor. We spoke with companies moving back from cloud to on-premises infrastructure purely for cost control. Others are ripping out incumbent monitoring stacks imposed by headquarters and rebuilding on OpenTelemetry, not because OTel is technically superior in every dimension, but because it gives them independence.
Even in extreme environments, the pattern holds. Aerospace companies demonstrated Kubernetes operating infrastructure at what they called “planetary scale.” Open source in orbit. The argument for sovereignty becomes harder to dismiss when it’s literally being deployed in space.
The most interesting version of this conversation was about AI sovereignty specifically. Scaling AI in production is far more complex than making an HTTP call to an API. It requires deep Kubernetes tuning, sophisticated load balancing, and careful resource management. Organizations that delegate all of this to a single vendor are making a bet that the vendor’s interests will permanently align with theirs. The companies at KubeCon, overwhelmingly, are choosing not to make that bet.
3. Observability is the connective tissue for everything else
Every theme above, agents, sovereignty, AI at scale, depends on one prerequisite: you have to be able to see what’s happening. Observability was not a separate track at this KubeCon. It was the substrate underneath every conversation.
The market signal was consistent across the booths and the hallway conversations. Multiple enterprises we spoke with, across insurance, retail, financial services, and e-commerce, are actively evaluating alternatives to their incumbent monitoring platforms. The pattern is the same: costs have grown faster than the value delivered, and teams want more control over their telemetry pipelines.
OpenTelemetry has become the gravitational center. Not because it solves every problem, but because it decouples instrumentation from vendor lock-in. Companies can collect telemetry once and route it to whatever backend serves them best, and switch backends when the economics change.
The exhibition floor told a different story than the keynote
This is worth stating directly. The keynotes painted a clear, convergent picture: agents, open source, sovereignty, Kubernetes as the AI operating system. The exhibition floor told a more honest story. Integration is still a mosaic. Every organization is experimenting with different approaches, often very different from each other depending on context, stack, and maturity level.
That gap between vision and execution is precisely where the work is. The companies that will benefit most from this wave are not the ones who adopt the newest tools fastest. They are the ones who understand their own infrastructure deeply enough to know which tools solve a real problem and which ones add complexity for its own sake.
This is what our Customer Connect “On Tour” was designed around. We took customers through the exhibition floor, ran curated demos, and facilitated conversations between organizations facing similar challenges. Seeing customers from completely different industries sit at the same table to share strategies, blockers, and what actually worked in production, that’s where the real value of an event like KubeCon lives. Not in the keynotes. In the hallway track.
What we’re watching
Beyond the major themes highlighted during the keynotes, we dedicated significant time to exploring the vendor exhibition areas with customers, scouting the most noteworthy technologies at KubeCon.
Several tools and developments particularly caught our attention, which we have organized into these four key areas:
- Observability & OpenTelemetry: Focused on collecting, normalizing, and analyzing telemetry data (metrics, logs, traces) using open standards like OpenTelemetry, ensuring full system visibility and interoperability across cloud and microservices environments.
- AI SRE: Solutions that integrate AI and automation into Site Reliability Engineering, improving incident detection, automated triage, root cause analysis, and proactive system resilience management.
- Cloud-Native Developer & Platform Tooling: Tools and platforms for cloud-native developers, including Infrastructure as Code, testing, API management, caching, and runtime performance, to accelerate development, deployment, and management of modern applications in Kubernetes and cloud environments.
- Performance/Cost Optimization and FinOps: Technologies and practices that optimize operational efficiency and cloud costs, measure unit economics, improve runtime and resource performance, and support FinOps decisions to maximize cloud ROI.
Observability & OpenTelemetry
Dash0 was the observability company generating the most floor traffic, and the momentum is backed by numbers: a $110M Series B at a $1B valuation announced weeks before KubeCon, on top of 600+ paying customers acquired in under two years. The founding team built Instana, sold it to IBM, and came back with a thesis that the economics of incumbent platforms are structurally broken. Their bet is that OpenTelemetry changes the game at the collection layer, and that AI agents change it at the action layer. The combination is compelling: transparent, volume-based pricing with an agentic copilot that creates alerts, dashboards, and pipeline rules rather than just surfacing data.
Honeycomb has long argued that observability data should be legible enough that engineers can find the signal themselves, without AI doing the correlation for them. That position has quietly shifted. Weeks before KubeCon, they launched Automated Investigations and expanded MCP integrations into Claude Code and Cursor. What hasn’t changed is their OpenTelemetry commitment: Honeycomb engineers are among the top contributors to the OpenTelemetry project, and their event-based pricing model remains one of the few in the market that doesn’t penalize teams for adding context to their telemetry.
OpenObserve takes the opposite bet. Built in Rust with columnar storage on Parquet, the platform claims 140x lower storage costs than Elasticsearch and processes petabytes on a fraction of the hardware. That cost structure matters because their AI SRE agent (O2) needs full-fidelity telemetry to work. It correlates across logs, metrics, and traces using log pattern recognition to compress millions of lines into a workable context window before an LLM layer runs root-cause analysis. The architecture is open source and self-hostable, which makes it the most credible option we saw for organizations that want agentic observability without sending their data to someone else’s cloud.
Checkly focuses on synthetic monitoring at scale, with Terraform integrations and an internal chatbot that can build checks for you. Dev-friendly with metrics that translate upward to C-level reporting. Checkly thoroughly convinced us by doubling down on their core strength: synthetic monitoring powered by Playwright. The monitoring-as-code workflow means the same Playwright tests that validate your PRs can monitor your production environment. No drift between what you tested and what you’re watching. But the MCP integration is what made us pay real attention. Checkly is building agent skills that let AI drive Playwright sessions to explore edge cases and non-recurring patterns that no human would script manually…
Splunk is not a discovery for us. We have built on the Splunk platform since 2009, carry 120+ certifications across our team, and have been named Splunk Partner of the Year Europe twice. We have deployed Splunk-based observability and security architectures for some of the most demanding banking, energy, and telecom environments in Europe. The post-Cisco Splunk is pushing toward unified observability for both IT operations and security, and the installed base is enormous. For many of our customers, the question is not whether to use Splunk but how to position it alongside OpenTelemetry pipelines and newer specialized tools. That integration work, making Splunk coexist with an OTel-first telemetry strategy rather than treating it as an all-or-nothing choice, is where we spend a growing share of our engineering time.
Dynatrace is a platform we know from the inside, as Moviri has worked with Dynatrace since 2015 and is an Advanced Partner with 30+ certified consultants. Davis AI proposes predictive, causal and generative models, and its analysis capability remains genuinely ahead of what open-source alternatives deliver: it maps dependencies automatically and identifies root causes across large, complex enterprise environments in ways that manual correlation cannot match. The trade-off is a more closed ecosystem compared to OTel-native newcomers, but extendable with custom integrations and Apps. The question we heard repeatedly on the floor is how Dynatrace will open its telemetry ingestion to OTel pipelines while keeping Davis as the differentiator on top. That coexistence model is where we are spending engineering time with customers right now.
These are different bets on the same problem. The common thread: observability needs to be automatic, scalable, and woven into the entire software lifecycle. As one of our team put it, observability as code and automatic scalability aren’t aspirational goals anymore. They’re table stakes.
AI SRE
Komodor does one thing well: Kubernetes troubleshooting. Their Klaudia AI agent speeds up root-cause analysis by scoping investigations narrowly rather than trying to reason across an entire infrastructure stack at once. At KubeCon they unveiled a multi-agent extension framework (via MCP and OpenAPI) that lets teams plug in their own tools alongside Komodor’s 50+ built-in specialist agents. It is designed to sit alongside your existing observability stack, not replace it, which is the right positioning for something this focused. Worth watching as Kubernetes environments grow more complex and SRE teams stay understaffed.
incident.io has a solid and transparent approach, completely free of ‘black box’ mechanics. Operating natively within major communication channels like Slack, its core focus is the incident itself. It offers a simple yet highly structured system that not only notifies teams but also enables actual remediation through clear workflows and intelligently leverages past similar incidents as a dynamic knowledge base.
PagerDuty PagerDuty’s core strength is on-call incident management that gets the right people engaged fast. What caught our attention is the MCP integration layered on top. When an incident fires, it no longer just sends an alert. It can trigger a resolution workflow executed through MCP or standard automation, which turns PagerDuty from a notification system into an orchestration point. They are also actively building a partner network in Italy, a signal they see the European market as underserved. For a platform this established, that combination of agentic capabilities and regional investment is worth tracking.
Rootly runs inside Slack, which is both its differentiator and its bet: the entire incident lifecycle, from triage through investigation to automated postmortem generation, happens in-channel without context-switching to a separate dashboard. The AI layer analyzes conversations, GitHub diffs, and observability data to surface probable root causes and auto-populate retrospectives. For teams already living in Slack, the friction reduction is immediate. For Slack-first shops, it focuses on end-to-end incident lifecycle, not just alerting or observability AI.
Cloud-native developer & platform tooling
Pulumi caught our attention by actively breaking away from the Terraform ecosystem’s reliance on complex, proprietary domain-specific languages (DSLs). By allowing teams to define infrastructure using standard programming languages they already know like TypeScript, Python, and Go it drastically lowers the learning curve. This approach makes the codebase accessible to standard development teams and simplifies integration with existing CI/CD workflows and automated pipelines.
Postman is showing renewed momentum after a period of stagnation, aggressively positioning itself as a market leader in API governance which, as we noted earlier, is the absolute prerequisite for any reliable AI/MCP architecture. Their ambition is to become the “GitHub of APIs.” They are maintaining a lightweight approach while using internal AI to simplify how teams build, enforce, and use governance rules. It is fascinating to contrast their strategy with competitors like Kong: while Kong is leaning heavily into becoming an active “API -> MCP -> Skill” gateway, Postman is focusing purely on providing the foundational guidelines and repository layer, rather than building the operational infrastructure dashboard.
Testkube, despite being a startup, surprised us with a pragmatic approach to continuous testing. They are tackling the shift-left challenge by offering a tool-agnostic platform that orchestrates any type of load testing directly within your existing Kubernetes clusters. By executing tests natively where the applications already live, it eliminates the need to spin up separate cloud environments or purchase external SaaS solutions, making infrastructure testing localized and cost-effective.
Varnish showcased a new product called Orca, specifically designed for artifact caching. This is worth exploring for organizations managing large-scale delivery pipelines, where cache efficiency directly dictates build and deployment speeds. More broadly on the shift-left side, we spent time evaluating pre-production testing and synthetic monitoring tools, actively looking for solutions mature enough to integrate into our consulting catalog. Several are getting very close, and we will share more specifics as we transition from these initial evaluations to real-world implementation.
Performance/cost optimization and FinOps
Akamas was born inside the Moviri ecosystem as a technology spinoff from our Performance Engineering practice. We caught up with CTO Stefano Doni at their Silver booth. Akamas does optimization, not observability, and that distinction matters. The platform uses reinforcement learning to tune the full stack, from JVM and Node.js settings to HPA and cluster-level resources, balancing cost, performance, and reliability rather than simply cutting spend. The human-in-the-loop design is their credibility differentiator: it ensures no AI agent makes unsupervised production changes by opening pull requests for developer review, a necessary stability-first approach in a market where many tools promise savings but few guarantee stability. Concurrent with KubeCon, the GigaOm 2026 Radar for Cloud Resource Optimization named Akamas a Leader and Outperformer for the third consecutive year.
Finout convinced us, though our assessment is tied to its aggressive focus on the cloud ecosystem. Rather than attempting to be a catch-all financial tool, it does cloud cost management and nothing else. For organizations running on cloud-native architectures, that specialization is the point: Finout dissects and allocates complex cloud and Kubernetes billing with a depth that generalist FinOps platforms do not match. In our opinion, these are two key features of Finout: Virtual Tagging and Megabill. Finout’s virtual tagging enables flexible organization and analysis of cloud costs, even without native tags. Megabill consolidates all cloud spending into a single, clear, centralized view.
Attribute is a modern observability platform built natively on OpenTelemetry. Attribute.io offers a key capability that enables cost analysis without requiring any tagging at all, making it one of its most distinctive features. Where most tools demand extensive tagging before they deliver value, Attribute simplifies telemetry collection, routing, and analysis out of the box, cutting the operational complexity. The more interesting capability is its ability to measure unit economics: it links performance data directly to cost per transaction or service, making unit economics measurable in a way that most engineering teams currently have to approximate. The foundation is open and vendor-neutral, which means no lock-in and clean interoperability with whatever stack you already run.
What comes next
KubeCon 2026 confirmed that the cloud-native ecosystem has entered its next phase. The platform question is settled. The AI question is open and urgent. The observability question is being answered in real time, with a clear shift toward open standards and away from monolithic vendor stacks.
We came to Amsterdam to scout technologies, connect with customers, and pressure-test our own thinking against what the market is building. We left with a sharper view of what matters and a concrete shortlist of tools and partnerships to pursue.
If you are working through any of these challenges and want to compare notes before then, you know where to find us. The engineering work starts now.
We will be back at KubeCon Europe 2027 in Barcelona. See you there!

© 2025 Moviri S.p.A.
Via Schiaffino 11
20158 Milano, Italy
P. IVA IT13187610152
'%3e%3cg%20id='Final-Copy-2_2_'%20transform='translate(1275.000000,%20200.000000)'%3e%3cpath%20class='st0'%20d='M7.4,12.8h6.8l3.1-11.6H7.4C4.2,1.2,1.6,3.8,1.6,7S4.2,12.8,7.4,12.8z'/%3e%3c/g%3e%3c/g%3e%3c/g%3e%3cg%20id='final---dec.11-2020'%3e%3cg%20id='_x30_208-our-toggle'%20transform='translate(-1275.000000,%20-200.000000)'%3e%3cg%20id='Final-Copy-2'%20transform='translate(1275.000000,%20200.000000)'%3e%3cpath%20class='st1'%20d='M22.6,0H7.4c-3.9,0-7,3.1-7,7s3.1,7,7,7h15.2c3.9,0,7-3.1,7-7S26.4,0,22.6,0z%20M1.6,7c0-3.2,2.6-5.8,5.8-5.8%20h9.9l-3.1,11.6H7.4C4.2,12.8,1.6,10.2,1.6,7z'/%3e%3cpath%20id='x'%20class='st2'%20d='M24.6,4c0.2,0.2,0.2,0.6,0,0.8l0,0L22.5,7l2.2,2.2c0.2,0.2,0.2,0.6,0,0.8c-0.2,0.2-0.6,0.2-0.8,0%20l0,0l-2.2-2.2L19.5,10c-0.2,0.2-0.6,0.2-0.8,0c-0.2-0.2-0.2-0.6,0-0.8l0,0L20.8,7l-2.2-2.2c-0.2-0.2-0.2-0.6,0-0.8%20c0.2-0.2,0.6-0.2,0.8,0l0,0l2.2,2.2L23.8,4C24,3.8,24.4,3.8,24.6,4z'/%3e%3cpath%20id='y'%20class='st3'%20d='M12.7,4.1c0.2,0.2,0.3,0.6,0.1,0.8l0,0L8.6,9.8C8.5,9.9,8.4,10,8.3,10c-0.2,0.1-0.5,0.1-0.7-0.1l0,0%20L5.4,7.7c-0.2-0.2-0.2-0.6,0-0.8c0.2-0.2,0.6-0.2,0.8,0l0,0L8,8.6l3.8-4.5C12,3.9,12.4,3.9,12.7,4.1z'/%3e%3c/g%3e%3c/g%3e%3c/g%3e%3c/g%3e%3c/svg%3e) Tracking Preferences
Tracking Preferences